
Figure 3.
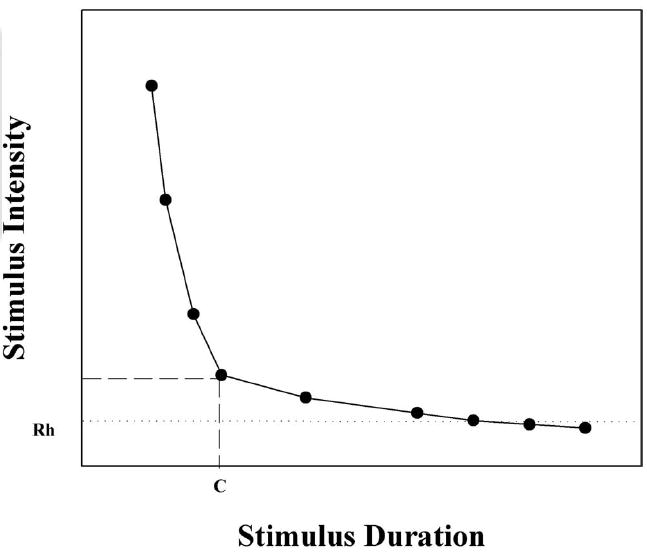
Example strength–duration curve denoting the corresponding rheobase (Rh) and chronaxie (C) values. Rheobase is defined as the minimum stimulus intensity needed to reach threshold response. Chronaxie is the stimulus duration necessary to reach threshold response at a stimulus intensity set to twice the rheobase current.