
Figure 4.
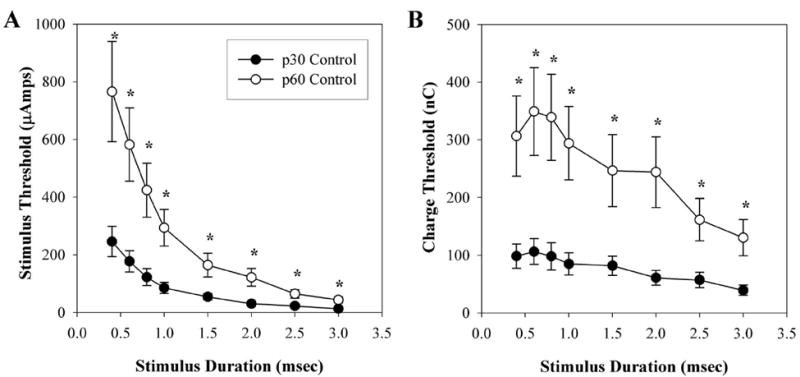
Mean EECP thresholds in untreated control, acquired at p30 and p60. (A) strength–duration curve relative to stimulus duration. (B) Charge threshold curve relative to stimulus duration. *P < 0.05 **P < 0.001 p30 vs. p60. Error bars, ±SEM.
Official websites use .gov
A
.gov website belongs to an official
government organization in the United States.
Secure .gov websites use HTTPS
A lock (
) or https:// means you've safely
connected to the .gov website. Share sensitive
information only on official, secure websites.
Mean EECP thresholds in untreated control, acquired at p30 and p60. (A) strength–duration curve relative to stimulus duration. (B) Charge threshold curve relative to stimulus duration. *P < 0.05 **P < 0.001 p30 vs. p60. Error bars, ±SEM.