
Figure 5.
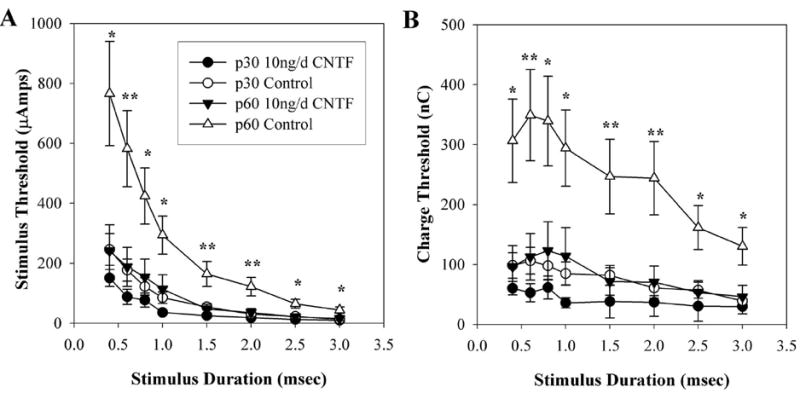
Effects of 10-ng/d CNTF treatment on mean EECP thresholds. Data points represent the mean of both control and 10-ng/d CNTF–treated animals acquired at both p30 and at p60. (A) strength–duration curve relative to stimulus duration. (B) Charge threshold curve relative to stimulus duration. *P < 0.05, **P < 0.001 (10 ng/d CNTF p60 vs. control p60). Error bars denote ± SEM.