
Figure 8.
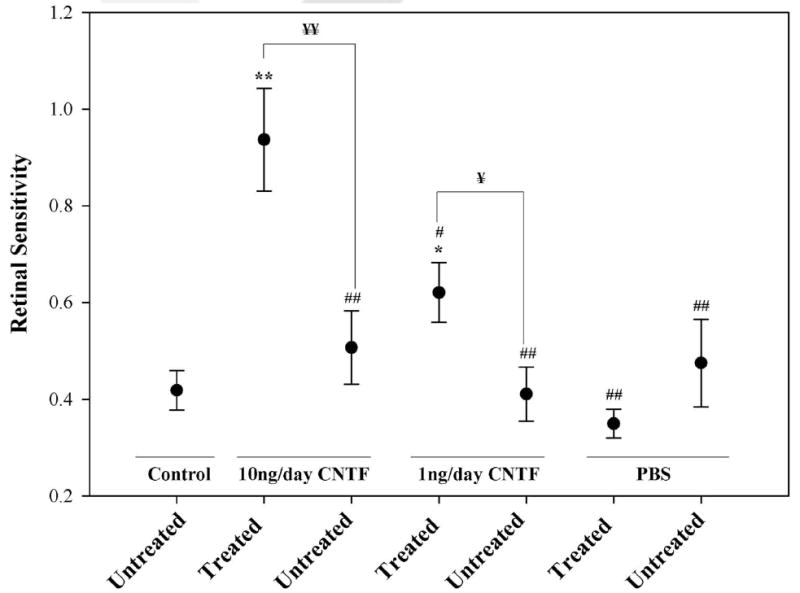
Retinal sensitivity to electrical stimulation as determined from p30 and p60 EECPs thresholds. Data are the mean ± SEM. Statistical significance denoted by *P < 0.05, **P < 0.001 when compared to untreated control animals; ¥P < 0.05, ¥¥P < 0.001 treated eyes versus untreated eyes within the same treatment group; #P < 0.05, ##P < 0.001 when compared to 10 ng/d-CNTF–treated animals.