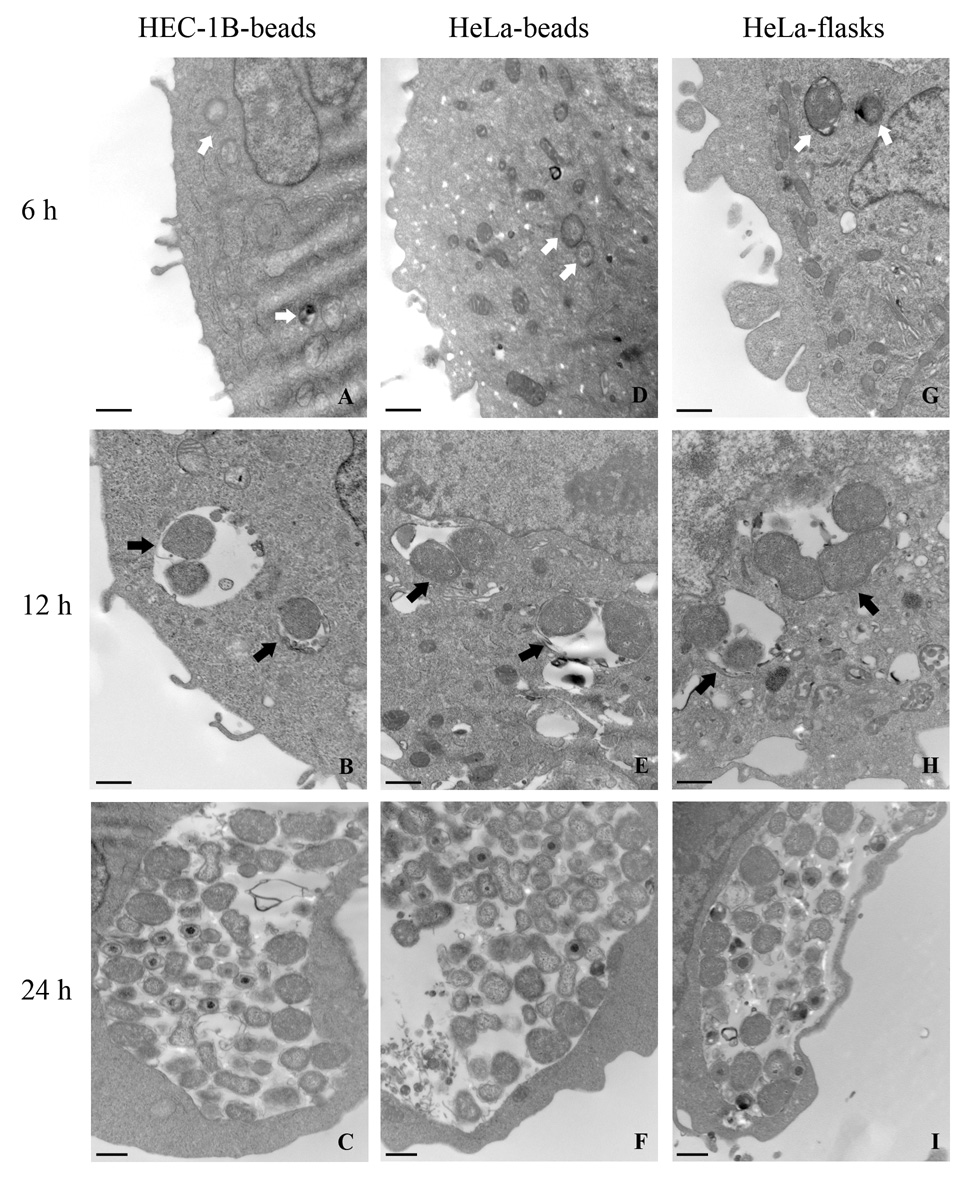
Fig. 2.

Transmission electron micrographs of C. trachomatis serovar L2 early development in HEC-1B and HeLa cells grown on microcarrier beads and in HeLa cells seeded in tissue culture flasks. The two left panels represent HEC-1B cells (A–C) and HeLa cells (D–F) from infected bead cultures; the right panel (G–I) represents infected HeLa cells collected from tissue culture flasks. The times (6–24 hpi) at which bead culture samples were collected are also indicated. Bar = 500 nm.
