
Fig. 5.
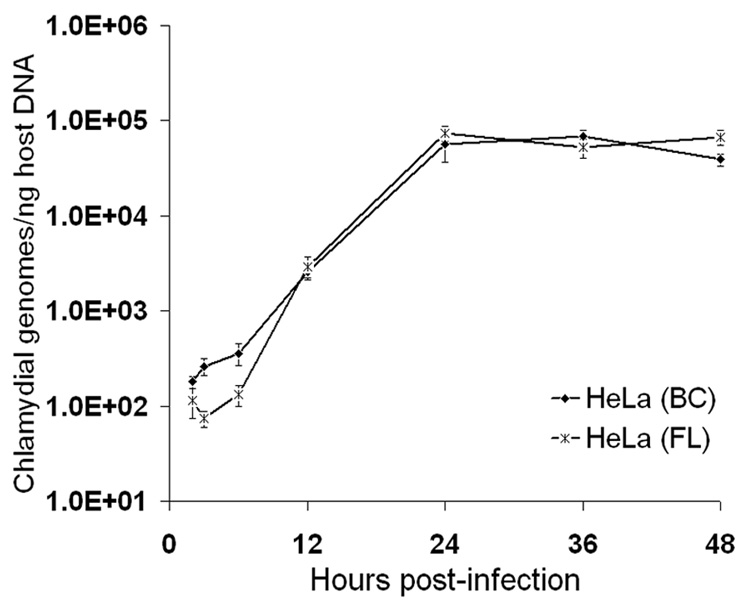
Real-time PCR analysis of C. trachomatis serovar L2 growth in HeLa cells seeded on microcarrier beads or in tissue culture flasks. Chlamydial genomes were quantitated from cultures collected at 2, 3, 6, 12, 24, 36 and 48 hpi using euo- and omcB-specific primers and purified EB gDNA as standards. Host cell gDNA content in each of the samples was also determined, using qPCR primer sets specific for two target genes and purified HeLa cell gDNA standards. The X-axis represents the time post-infection; the Y-axis represents the number of chlamydial genomes, normalized to host gDNA content, and expressed as copy numbers per ng of host DNA. The data shown are from a representative time-course experiment and represent average results from triplicate qPCR wells and two independent runs (± SD).