Figure 2.
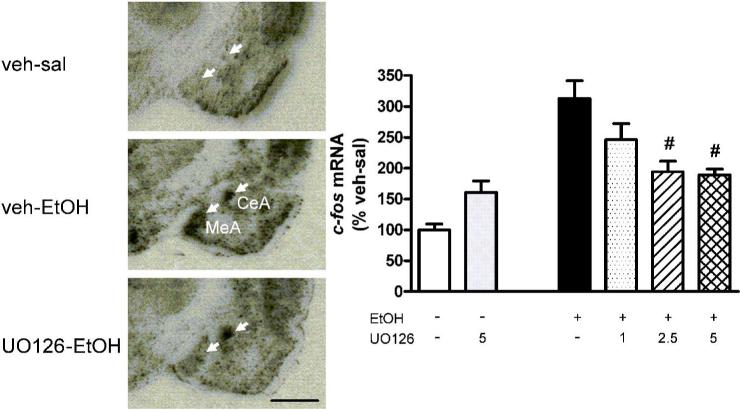
Right: Bar graph illustrating c-fos expression in the medial amygdala after UO 126 (1, 2.5 and 5 nmol, icv) and EtOH (1.5 g/kg, i.p.) treatment in naïve Wistar rats. Corrected p-values: ***p < 0.001 vs veh-sal group, #p < 0.05 vs veh-EtOH control group.
Left: Bright-field microphotographs from autoradiograms of in situ hybridization of c-fos mRNA in the amygdala region after UO126 (5 nmol, icv) and EtOH (1.5 g/kg, i.p.) treatment in naïve Wistar rats. Arrows indicate c-fos mRNA in MeA and CeA. c-fos mRNA levels are increased in both MeA and CeA after ethanol challenge and decreased in MeA after UO126 treatment. UO 126 treatment show no effect on ethanol-c-fos in CeA, scale bar = 1 mm, for abbreviations see figure 1, for details on treatment, see Material and Methods

