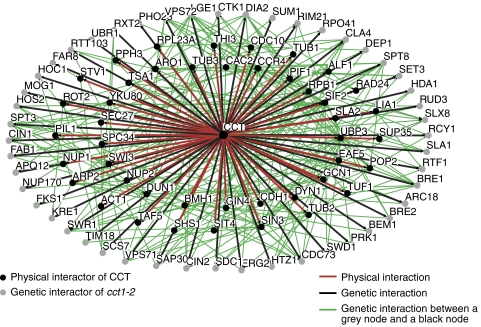
Figure 4.
Integration of the CCT interactome with known interactions reveals putative substrate proteins. Network diagram showing integrated physical and genetic interactors of CCT. Those physical interactors of CCT that exhibit a genetic interaction with at least one genetic interactor of CCT (green lines) are shown. The outer ring (grey nodes) represents SGA hits and the two inner rings (black nodes) represent physical interactors of CCT (see text for description and Supplementary Table S7A).

