
Figure 3.
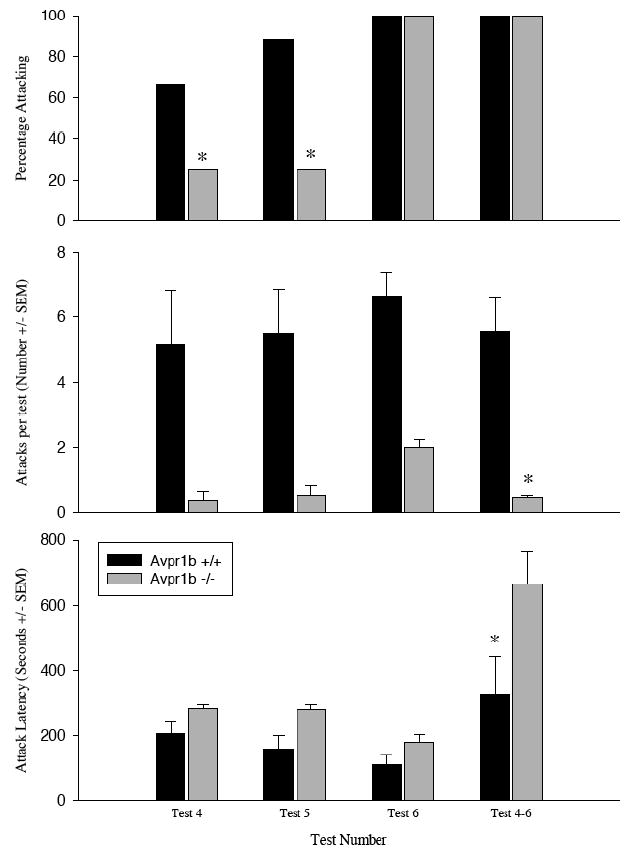
Offensive behavior in Avpr1b +/+ and Avpr1b −/− mice. Top Panel. The percentage of animals displaying offensive aggression. Center Panel. The number of attacks (± SEM) in test 4, 5, and 6 as well as the average number of attacks per test (± SEM) when the data are pooled across tests 4-6 (* = significantly lower than the other genotypes; p<0.05) Bottom Panel. The latency to attack (± SEM). Knockouts took significantly longer to attack than did wild-types. (* = significantly lower than Avpr1b +/+ group; p<0.05).