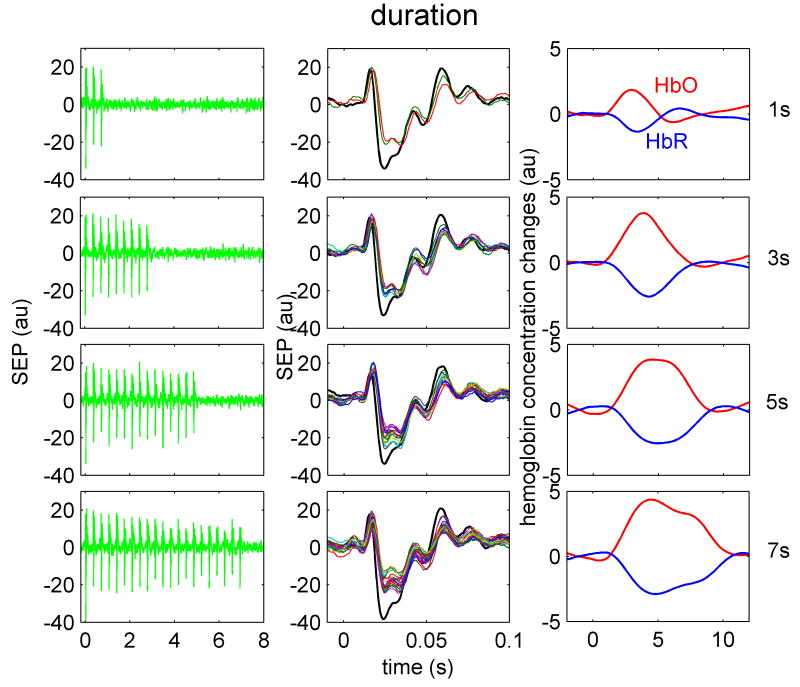
Figure 2.
Temporal SEP and hemoglobin response traces to four different train durations in one animal. Train durations, from top to bottom are 1, 3, 5, 7 s, respectively. Left panels are the SEP responses to stimulation train. Middle panels are the overlapped SEP responses for each individual stimulus in the train. The black trace represents the response to the first stimulus in the train. The right panel illustrates the HbO (red) and HbR (blue) responses for the corresponding train. Both SEP and hemoglobin responses shown are averaged over the same number of trains during all stimulation runs.

