
Figure 4.
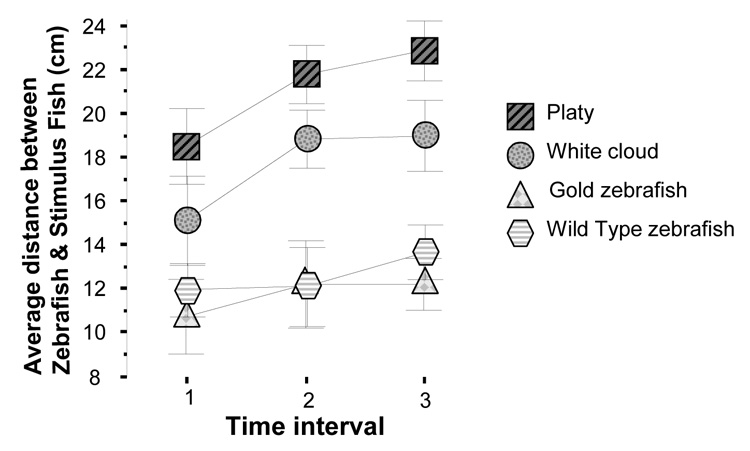
Average distance between stimulus fish and experimental zebrafish across three intervals. Mean ± S.E.M. are shown for three time intervals: T1 = 60–90 sec, T2 = 300 – 330 sec, T3 = 570 – 600 sec (where 0 sec is the start of the recording session). Sample sizes are as in figure 1. Note that although a significant time effect was found suggesting an overall increase of distance, the time × stimulus treatment interaction was non-significant, i.e. the effect of stimulus treatment was independent of the time. For details of results of the statistical analysis, see Results section.