
Figure 7.
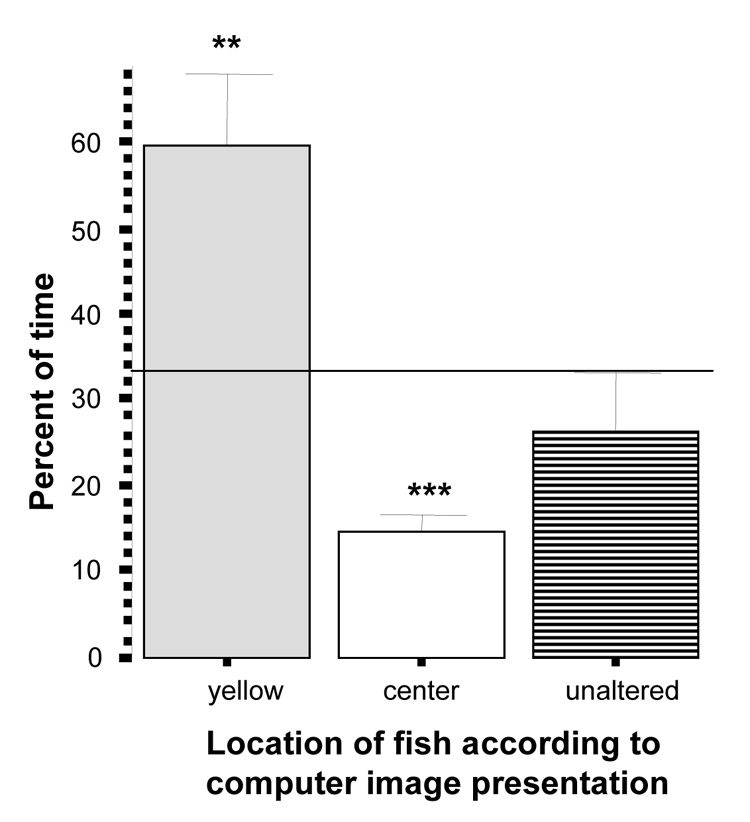
Percent of time zebrafish spent near the yellow images side, the unaltered images side or the center of the tank. Mean ± S.E.M. are shown (n=10). Random chance (33%) is indicated by the horizontal line. Significant deviation from random chance is indicated by asterisks (*p < 0.05, **p<0.01, ***p<0.001). Note that zebrafish showed a significant preference for the yellow images.