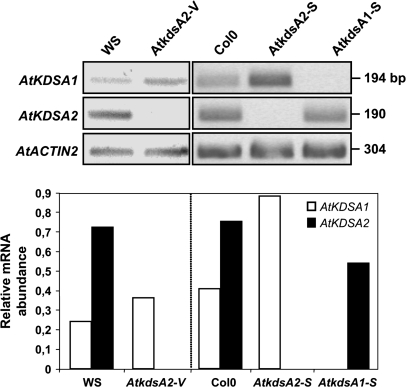
Fig. 2.
AtKDSA1 and AtKDSA2 gene expression analysis in the T-DNA insertion AtkdsA1-S, AtkdsA2-S, and AtkdsA2-V null mutants. The AtKDSA1 and AtKDSA2 mRNA expressions in seedlings of the mutant lines and corresponding WT ecotypes were analysed by semi-quantitative RT-PCR and the AtKDSA1 and AtKDSA2 mRNA relative abundance was quantified by image scanning of the autoradiogram using the Quantity One software from BioRad Laboratories (Hercules, CA, USA), normalized to AtACTIN2 used as a positive control of PCR, and expressed as a ratio of arbitrary units for pixel intensities. Relative quantification data were the mean value of two repeats.

