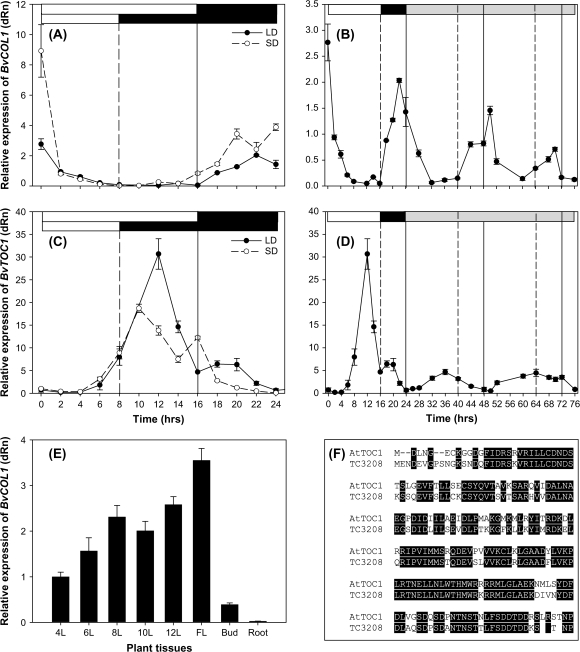
Fig. 5.
Expression profiles of BvCOL1 and a putative BvTOC1 in biennial sugar beet. Quantified transcription of BvCOL1 and BvTOC1 (TC3208) (Boxall et al., 2005) by QRT-PCR. BvCOL1 (A, B) and BvTOC1 (C, D) transcription in leaf tissues from 1-month-old plants (with eight fully-expanded leaves) over a 24 h period (A, C) and from plants moved to continuous light following entrainment under LDs (B, D). BvCOL1 transcription in developing leaves (4L to 12L) and in different organs (leaves of elongating stems; FL, floral bud; bud; and roots) sampled in LDs (E). Alignment of protein sequence of BvTOC1 against AtTOC1 showing a high degree of homology (76% amino acid identity) in the signal-receiver domain (F). Bars above represent the light (white), dark (black) or subjective light (grey) periods of the day. Solid and dashed lines represent expression levels for plants grown under LD and SD, respectively. Error bars represent standard error of three biological and three technical repetitions.

