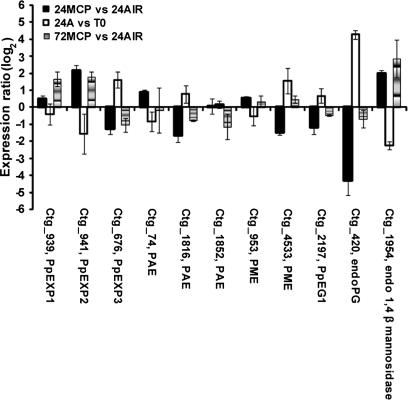
Fig. 7.
Hybridization intensity ratio, reported as log2, of probes spotted on μPEACH1.0 and significant at SAM analysis corresponding to genes involved in cell wall metabolism. The ratio has been calculated by comparing, in three microarray experiments, the hybridization signal of cDNAs corresponding to transcripts of fruit sampled at harvest (T0), after 24 h in air (24A) or in 1-MCP (24MCP), and 48 h in air from the end of 1-MCP treatment (72MCP). Log value is the average of a minimum of four replicates. Bars indicate standard deviation. Abbreviations: EG, endo-β-1,4-glucanase; endoPG, endopolygalacturonase; EXP, expansin; PAE, pectin acetylesterase; PME, pectin methylesterase.

