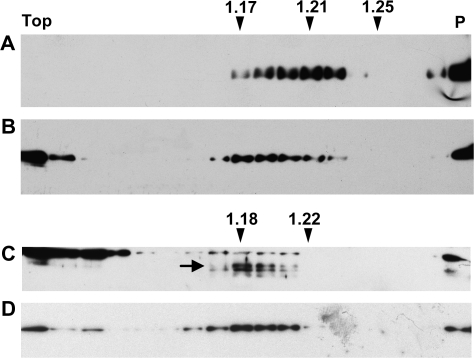
Fig. 10.
Density of zeolin–Nef protein bodies. Young leaves from transgenic tobacco expressing zeolin–Nef (A, B) or zein–Nef (C, D) were homogenized in the absence of detergent and the presence of sucrose. The homogenates were fractionated by centrifugation on isopycnic sucrose gradient. Proteins in each gradient fraction were analysed by SDS–PAGE and protein blot, using anti-Nef (A, C) or anti-BiP (B, D) antibodies. In (C), the position of zein–Nef is indicated by an arrow; the other bands represent immunoreactive endogenous tobacco proteins, revealed because of the long exposure needed to detect zein–Nef. Numbers at top indicate density (grams per millilitre). The top of the gradients is on the left (Top); the pellet precipitated at the bottom of the tubes, probably representing unbroken tissue, is on the right (P).

