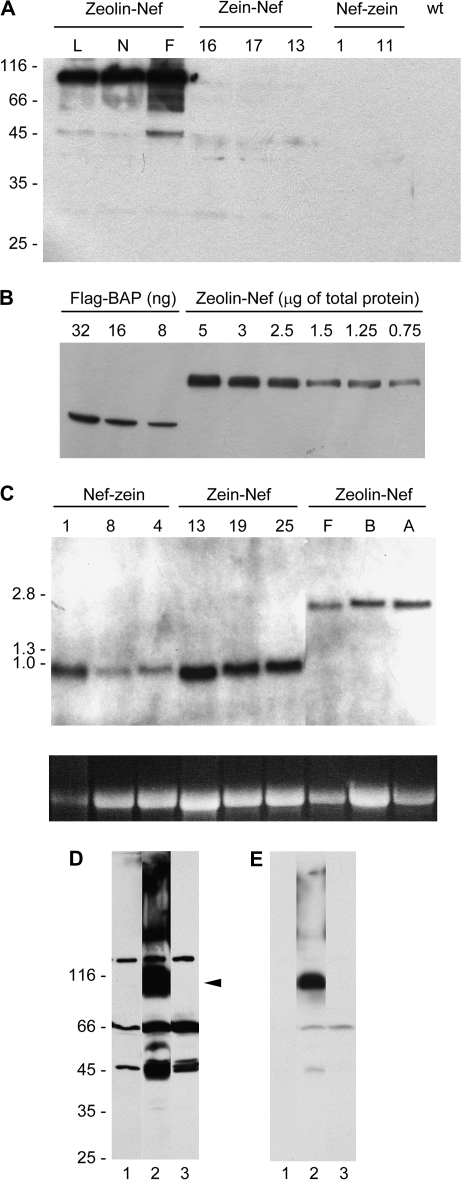
Fig. 6.
Zeolin–Nef accumulates to much higher amounts than zein–Nef or Nef-zein. (A) Proteins were extracted with reducing buffer from young leaves of independent transgenic lines of tobacco expressing zeolin–Nef (lines L, N, and F), zein–Nef (16, 17, and 13), or Nef-zein (1 and 11) or from wild-type tobacco (wt). Analysis was by SDS–PAGE followed by protein blot using anti-γ-zein antiserum. (B) Different amounts of commercial Flag–BAP or total protein extracts from young leaves of tobacco plants expressing zeolin–Nef (transgenic line F, see A) were analysed by SDS–PAGE followed by protein blot using anti-Flag antibodies. (C) RNA was extracted from plants transformed as in (A) (three independent transgenic lines each, identified by numbers or letters) and hybridized with a probe corresponding to the zein portion of zeolin DNA. The image at the bottom shows ethidium bromide staining of 28S RNA in each lane, as a control for gel loading differences. In (A), (B), and (C), letters and numbers at the top identify the different independent transgenic lines. (D) Proteins were extracted with reducing buffer from young leaves of wild-type tobacco (lane 1) or tobacco expressing zeolin–Nef (lane 2) or zein–Nef (lane 3). Analysis was by SDS–PAGE followed by protein blot using anti-Nef antibody. The position of intact zeolin–Nef (arrowhead) is marked. (E) Shorter exposure of the protein blot shown in (D). Numbers on the left indicate the positions of molecular mass markers, in kilodaltons (A and D) or kilobase pairs (C).

