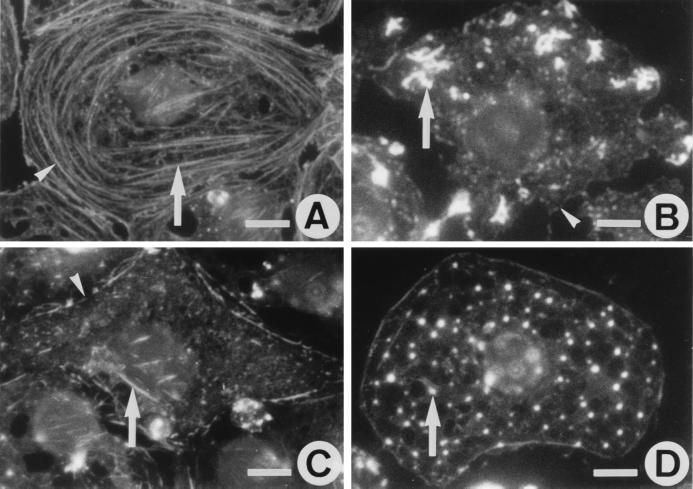
Figure 1.
Fluorescence micrographs showing the effects of misakinolide, swinholide A, and jasplakinolide on actin organization in LSECs, monitored with rhodamine-phalloidin staining. (A) Actin distribution in control LSECs shows the presence of stress fibers (arrow), mainly oriented parallel to the long axis of the cells, and peripheral bands (arrowhead) of actin bundles that line the cell margin. (B) LSECs treated with 25 nM misakinolide for 10 min, show a loss of actin bundles, and the appearance of curly actin aggregates (arrow). Peripheral actin bands (arrowhead) are less dense and interrupted. (C) LSECs treated with 25 nM of swinholide A for 10 min also show loss of actin bundles and less dense peripheral bands with interruptions (arrowhead), whereas the cytoplasm is faintly stained and still with short and fine filaments (arrow). (D) LSECs treated with 25 nM jasplakinolide for 60 min show a complete loss of their actin bundles and the appearance of actin dots (arrow) throughout the cytoplasm. (Scale bars, 5 μm).

