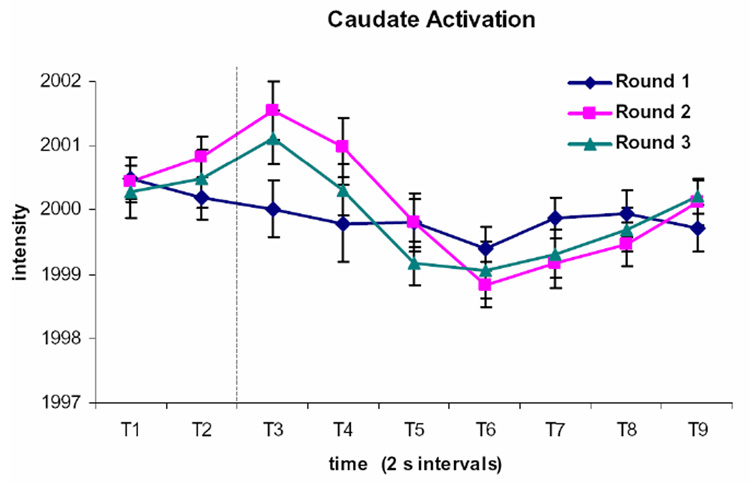
Figure 3. Time Course of Activation in the Caudate Region Displaying a Round by Time Effect.

The caudate nuclei displayed a relatively flat pattern of activation during Round 1 trials, while there is greater activation during Rounds 2 and 3. The activation is somewhat attenuated on Round 3 relative to Round 2. The time course is shown for the bilateral activation cluster identified as showing a Round by Time interaction. Each time period (T1, T2, etc.) represents a 2 s image acquisition. The dotted line indicates the onset of the feedback display.
