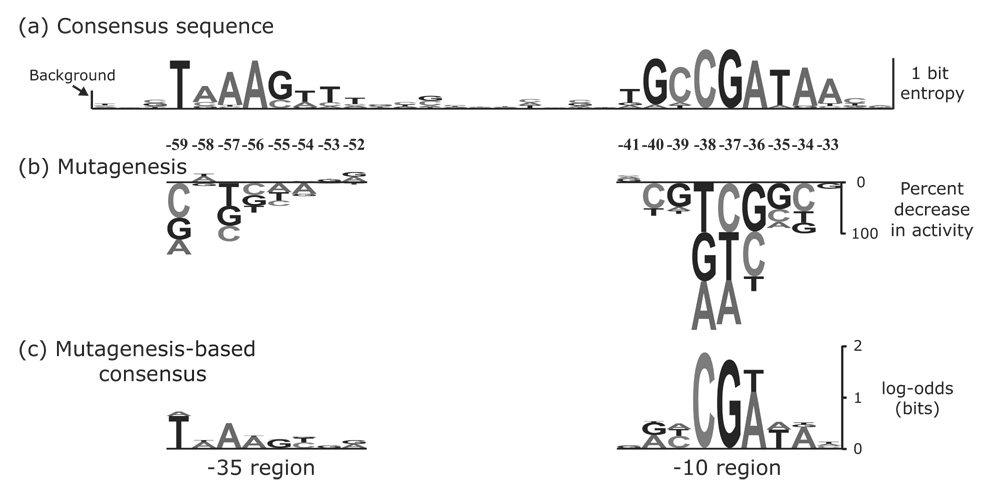
Figure 3.

Comparison of the class 3 consensus sequence to the activities of flgKL promoter mutants.(a) The class 3 consensus sequence was constructed from the alignment of 17 flagellar promoters in Table 2 of Ide, et. al.5 The height of each WebLogo-like nucleotide stack49 corresponds to that position’s entropy,16 which is a measure of the conservation of nucleotides at that position. The frequency of each nucleotide in the alignment is reflected by the height of that nucleotide within the stack. On the left side of the figure, the height of the bar labeled background is twice the small sample correction as calculated by WebLogo.49 The small sample correction gives the average entropy value for a random alignment of sequences.50 (b) All single base pair mutations for eight positions in the −35 region and nine positions in the −10 region of the flgKL class 3 promoter were constructed. The height of each letter corresponds to the percent change in promoter activity as quantified by β-galactosidase assays. Letters above or below the line indicate an increase or decrease, respectively, in promoter activity. The numbers above the DNA indicate the distance from the start codon. (c) The measured activities in (b) were used as counts in a new “alignment” in order to generate a new consensus sequence. The log-odds scores displayed were calculated using these counts and are a measure of the conservation of nucleotides in the alignment.
