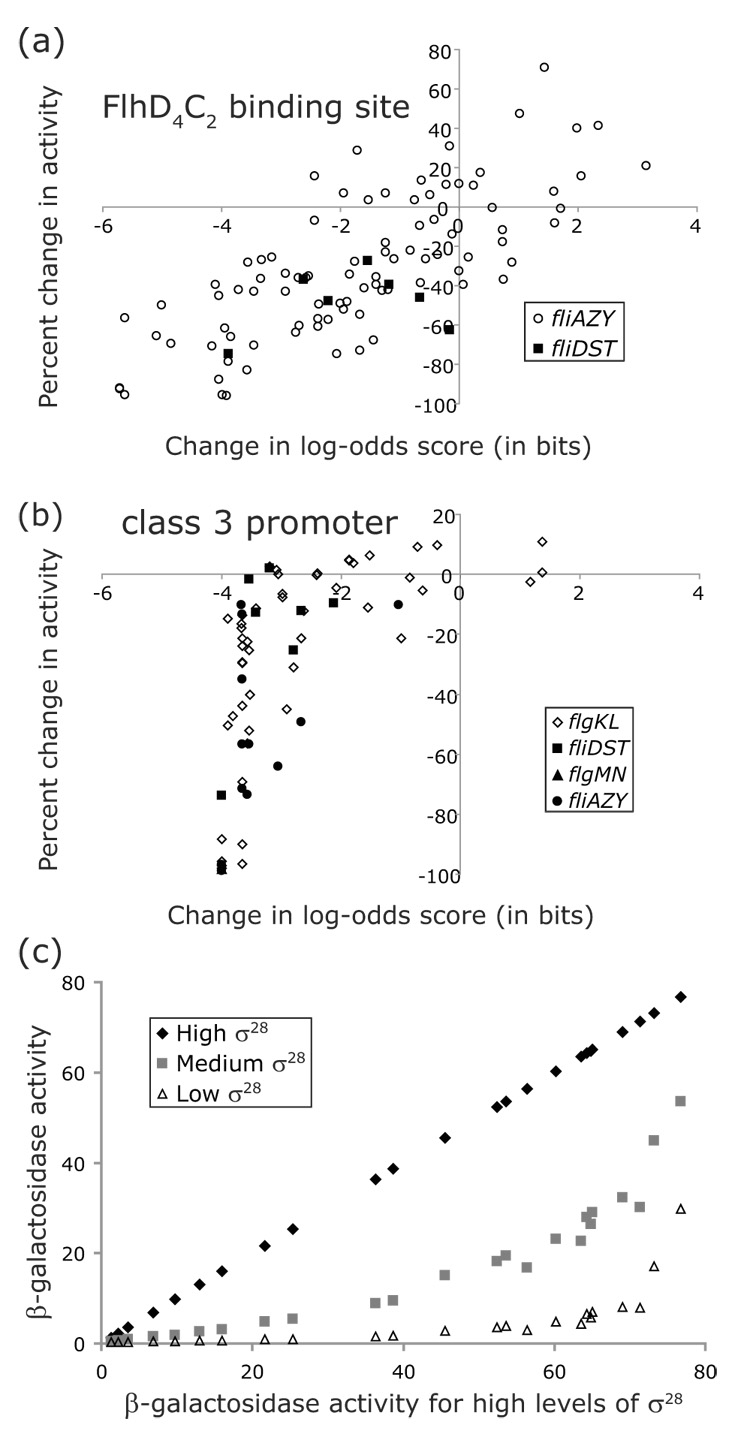
Figure 7.

Comparison of log-odds scores to the activities of mutated promoters. For mutations in the FlhD4C2 binding sites (a) or the class 3 promoters (b), the change in log-odds scores calculated from the consensus sequence was plotted against the observed change in promoter activity. (c) The activities of a subset of the class 3 flgKL promoter mutants were assayed in backgrounds expressing high (162% of wildtype), medium (110% of wildtype), or low (64% of wildtype) levels of class 3 transcription. The activities of the mutants in these three backgrounds were plotted against their activity in the high class 3 transcription background. The β-galactosidase activities in (c) are expressed in units of nmol/min/OD650/ml.
