
Figure 1.
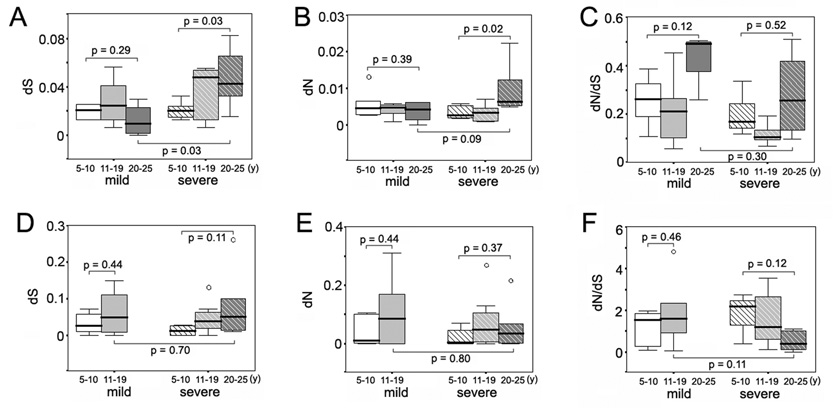
Variation of intra-specimen dS, dN and dN/dS ratio of the E1 and HVR regions according to years of disease progression in the mild and severe disease groups. Panel A, synonymous substitution rate of the E1 region in the mild and severe disease groups. Panel B, non-synonymous substitution rate of the E1 region in the mild and severe disease groups. Panel C, non-synonymous to synonymous (dN/dS) ratio of the E1 region in the mild and severe disease groups. Panel D, synonymous substitution rate of the HVR1 region in the mild and severe disease groups. Panel E, non-synonymous substitution rate of the HVR1 region in the mild and severe disease groups. Panel F, non-synonymous to synonymous (dN/dS) ratio of the HVR1 region in the mild and severe disease groups.