
Figure 4.
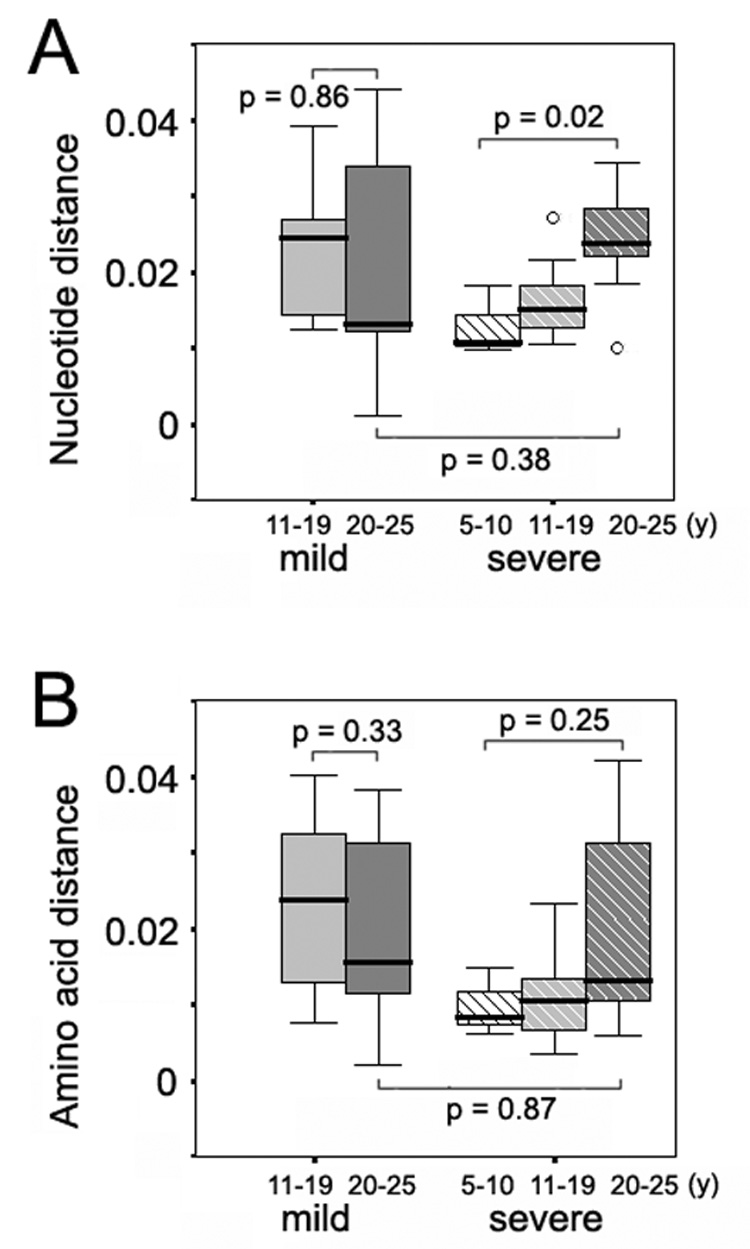
Variation of inter-specimen genetic distance of the E1 region according to years of disease progression in the mild and severe disease groups. Panel A, inter-specimen nucleotide distances of the E1 region in the mild and severe disease groups. Panel B, inter-specimen amino acid distances of the E1 region in the mild and severe disease groups.