
Figure 5.
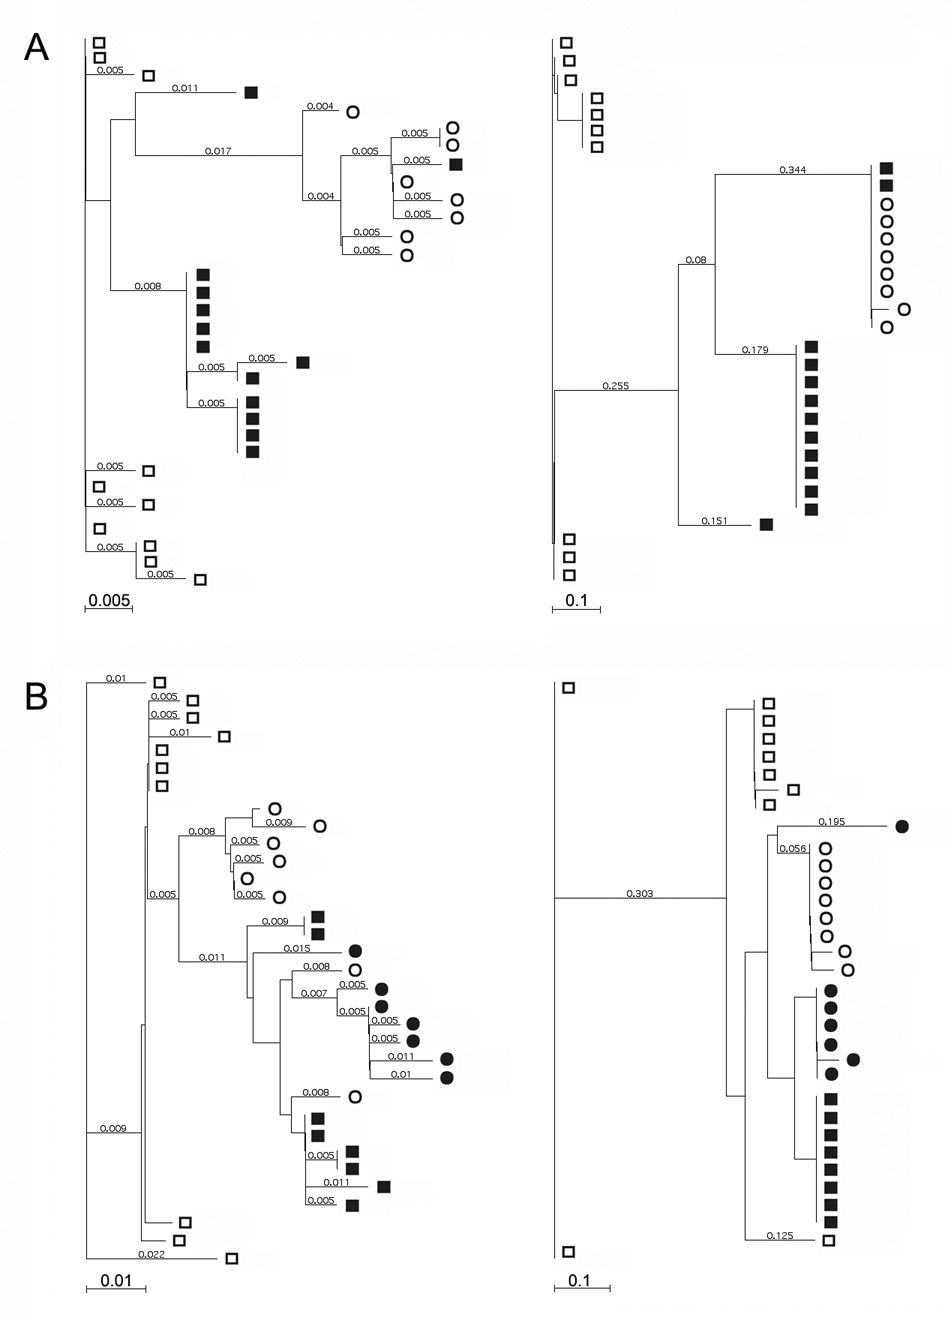
Phylogenetic trees constructed according to the amino acid sequences of the E1 and HVR regions obtained from representative individuals within the mild and severe disease groups. The trees were constructed with the neighbor-joining method, and Poisson-correction distances were shown with each branch. Panel A, phylogenetic trees based on the E1 (on the left) and HVR (on the right) amino acid sequences from a representative individual with mild disease. Sequences at various time points are indicated by various symbols (□, 1987; ■, 1988; ○, 1996). Panel B, phylogenetic trees based on the E1 (on the left) and HVR (on the right) amino acid sequences from a representative individual with severe disease. Sequences at various time points are indicated by various symbols (□, 1989; ■, 1994; ○, 1996; ●, 1997).