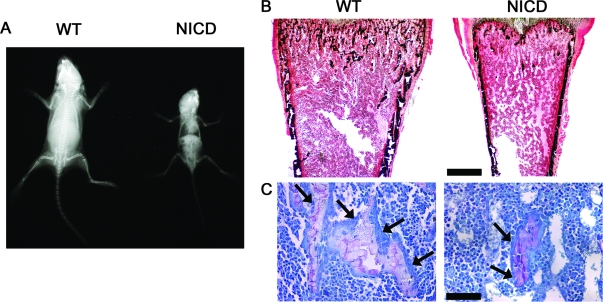
Figure 1.
Phenotype of NICD-overexpressing mice. A, Representative skeletal radiograph of a 4-wk-old WT control and a NICD transgenic mouse. B and C, Representative bone histomorphometry performed on femurs from 4-wk-old WT control and NICD transgenic mice stained with Von Kossa (B) and toluidine blue (C). Final magnifications, ×40 (B) and ×400 (C). Bars, 400 μm (B) and 40 μm (C). Arrows point to osteoblasts.

