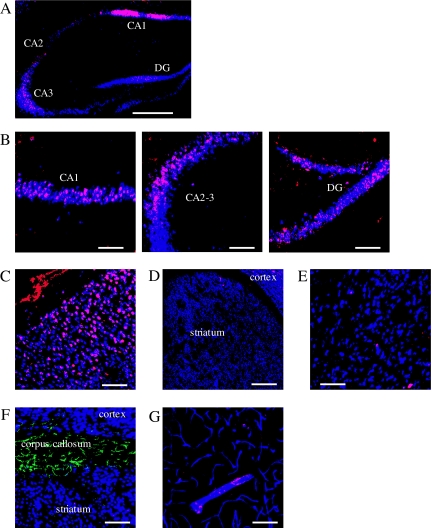
Figure 1.
Immunohistochemical examination for MR expression in the brain under normal conditions. A–E, Immunostaining of Neu-N (blue) and MR (red) in the hippocampus (A), CA1, CA2–3 region of the dentate gyrus (B), cerebral cortex (C), and striatum (D and E). Neu-N-positive neurons expressing MR are shown in purple (blue + red). F, Immunostaining of Neu-N (blue), MR (red), and GFAP (green) in the corpus callosum. G, Immunostaining of PECAM-1 (blue), MR (red), and GFAP (green) in the striatum. Scale bar, 500 μm (A and D), magnification, ×5; scale bar, 100 μm (B and C, E and G), magnification, ×20.

