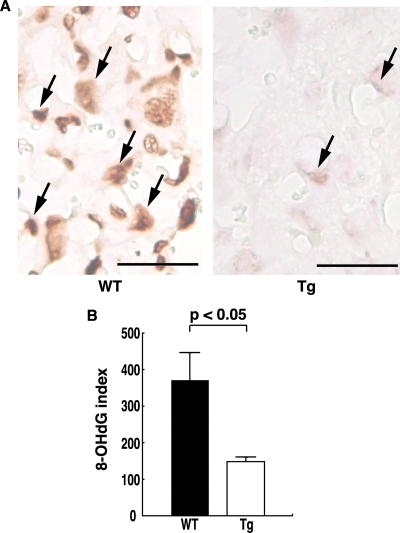
Figure 3.
Immunostaining of labyrinthine trophoblasts for 8-OHdG. A, 8-OHdG expression was prominent in the placentas of WT mice, whereas it was weak in the placentas of hTRX-1 Tg mice (arrows). Scale bar, 50 μm. B, The 8-OHdG index of each group. Columns represent the mean ± sem for three dams determined by scanning densitometry data after immunohistochemistry. WT placentas are indicated by the closed columns, and Tg placentas are indicated by the open columns. P values were calculated by the Mann-Whitney U test.

