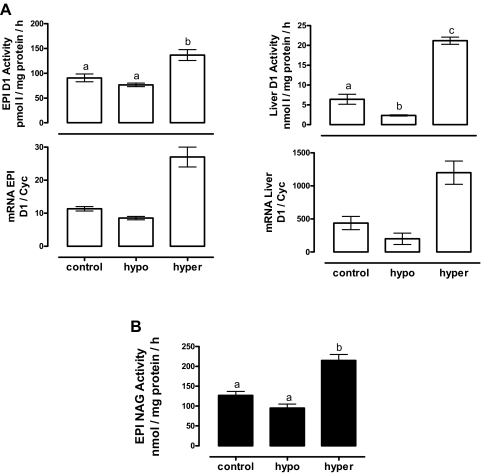
Figure 5.
Effect of thyroid status on D1 expression (A) and NAG activity (B). Liver was used as positive control for D1 activity. Optimal assay conditions for EPI and liver D1 activity were used (see Materials and Methods). NAG was measured by a colorimetric test. The data were analyzed with a one-way ANOVA, and differences between means were evaluated by the Tukey test. Different letters indicate significant differences between groups (P ≤ 0.05, n = 6). Two independent RNA samples were used for mRNA analysis. Hypo, Hypothyroidism; hyper, hyperthyroidism.

