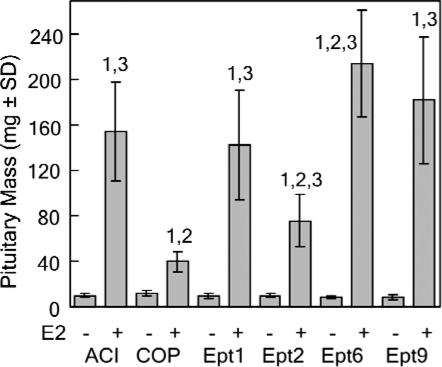
Figure 3.
Impact of Ept loci on pituitary mass after 28-wk E2 treatment. Female rats of each strain were treated with E2, released from sc SILASTIC brand implants, beginning at 9 wk of age. Control rats received empty implants. The rats were euthanized 28 wk later, and the pituitary glands were removed and weighed. Each bar represents the mean pituitary mass ± sd of the mean. The untreated control groups included three to five rats. The E2-treated groups included seven to 21 rats. Numeral 1 indicates a statistically significant (P < 0.05) difference relative to the corresponding untreated control group. Numeral 2 indicates a statistically significant difference relative to ACI rats receiving the same treatment. Numeral 3 indicates a statistically significant difference relative to COP rats receiving the same treatment.

