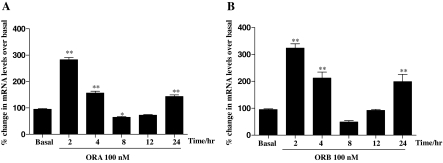
Figure 1.
Time-course effects of orexins on StAR mRNA levels in H295R cells. Cells were cultured for the indicated periods in the presence or absence (basal) of ORA (100 nm) (A) or ORB (100 nm) (B). Total RNA was isolated, reverse transcribed, and used as a template for quantitative PCR using StAR, and GAPDH specific primers. Results were normalized against GAPDH expression and expressed as percentage of basal. Data points are means ± se from six independent experiments. Significance was determined by Friedman’s ANOVA with Dunn’s test for post hoc analysis (*, P < 0.05; **, P < 0.01).

