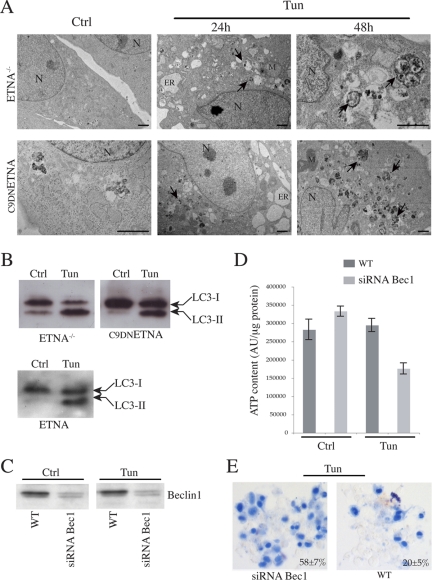
Figure 11.
The glycolytic metabolism of ETNA−/− and C9DNETNA cells under apoptotic treatment is based on Beclin 1–dependent autophagy. (A) Ultrastructural features by means of electron microscopy were observed in ultrathin sections from ETNA−/− and C9DNETNA cells untreated (Ctrl) or treated with 3 μg/ml tunicamycin (Tun; 24 h). Numerous autophagic vacuoles (black arrows) and dilation of endoplasmic reticulum (ER) are visible in the cytoplasm of tunicamycin-treated cells. The prolonged treatment (Tun; 48 h) enhances autophagic vacuole formation (black arrows). N, nucleus; M, mitochondrion; ER, endoplasmic reticulum. Scale bar, 1 μm. (B) Western blot analysis of LC3-I to LC3-II conversion in total lysates of ETNA−/−, C9DNETNA, and wild-type ETNA cells untreated (Ctrl) or treated with 3 μg/ml tunicamycin for 33 h (Tun). (C) Western blot analysis of Beclin 1 amount in ETNA−/− cells (WT) and in ETNA−/− cells transiently transfected for 48 h with siRNA duplex against Beclin 1 mRNA (siRNABec1) treated with 3 μg/ml tunicamycin for further 48 h (Tun) or left untreated for the same time (Ctrl). (D) ATP content in ETNA−/− cells (WT) and in ETNA−/− cells transiently transfected with siRNA duplex against Beclin 1 (siRNABec1) and treated with 3 μg/ml tunicamycin for 48 h (Tun) or left untreated (Ctrl) for the same time was measured. Values in D represent the mean ± SD of three experiments. (E) Representative images of trypan blue staining of C9DNETNA cells (WT) and C9DNETNA cells transiently transfected with siRNA duplex against Beclin 1 (siRNABec1) and treated with 3 μg/ml tunicamycin for 96 h (Tun) or left untreated (Ctrl) for the same time. Percentage of trypan blue–incorporating cells were determined by counting ∼1000 cells (per each condition and per each experiment) and calculating the average of three independent experiments ± SD.

