Figure 5.
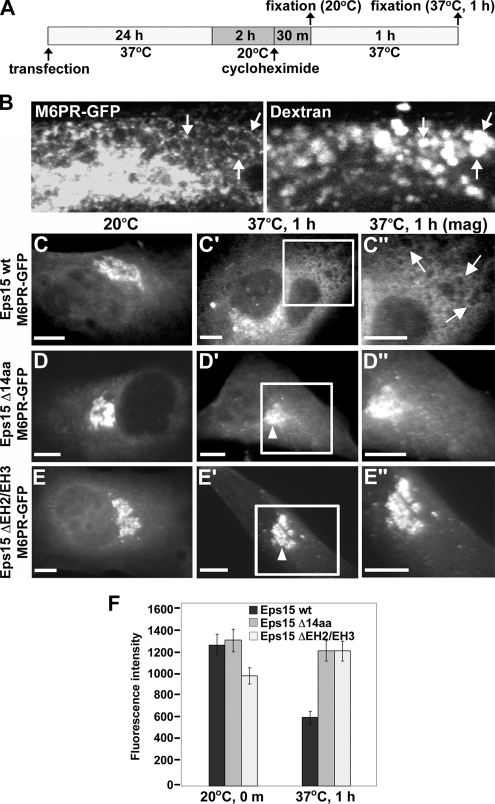
Eps15 is required for the transport of nascent proteins from the trans-Golgi network to late endosomes. (A) Schematic depicting the experimental procedure used to assay M6PR-GFP trafficking from the trans-Golgi network in BHK-21 cells. (B) To identify the late endosome and confirm the transport of nascent M6PR-GFP to this compartment, BHK-21 cells that had been transfected with M6PR-GFP and allowed to recover for 24 h were incubated at 20°C for 2 h and then warmed to 37°C for 1 h in the presence of rhodamine-labeled dextran to mark endosomal compartments. Bright rings of M6PR-GFP can be seen to delineate the periphery of dextran-containing endosomes (arrows). (C–E″) Cells expressing Myc-tagged versions of wild-type Eps15 (Eps15 wt, C–C″), the Eps15 deletion mutant lacking the 14-amino acid AP-1–binding motif (Eps15 Δ14aa, D–D″) or an Eps15 deletion mutant lacking the second and third EH domains (Eps15 ΔEH2/EH3, E–E″) were assayed for exit of M6PR-GFP from the Golgi as depicted in A. After the 20°C block, M6PR-GFP accumulates in the trans-Golgi network to similar extent in cells expressing either wild-type Eps15 (C) or the Eps15 deletion mutants (D and E). However, after warming to 37°C for 1 h, M6PR-GFP localizes to endosomal membranes in cells expressing Eps15 wt (arrows in C″), whereas M6PR-GFP is blocked in the Golgi in cells expressing Eps15 Δ14aa (arrowhead in D′; D″) or Eps15 ΔEH2/EH3 (arrowhead in E′; E″). Areas boxed in white in C′ and D′ and in E′ are shown at a higher magnification in the respective images to the right (C″, D″, and E″). Expression of Eps15 wild-type and deletion mutants was confirmed by immunostaining with anti-Myc antibody (data not shown). (F) Graph representing quantitation of the average fluorescence intensity of M6PR-GFP in a standardized area covering the Golgi compartment directly after the 20°C block or after 1 h at 37°C in cells expressing either wild-type Eps15 or the Eps15 deletion mutants. Forty cells were measured for each condition. Error bars, SE. Scale bars, 10 μm (C–E″).

