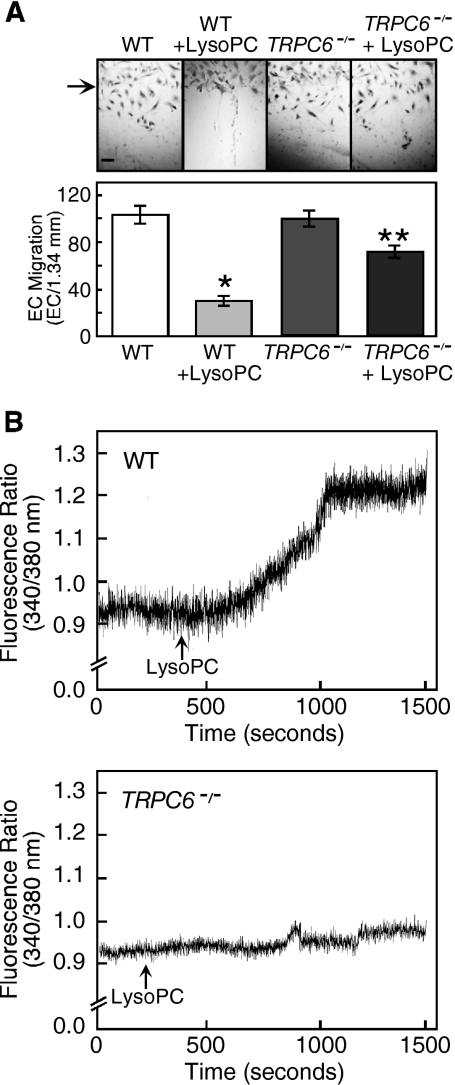
Figure 4.
LysoPC has little effect on [Ca2+]i or migration of TRPC6−/− MAECs. (A) ECs were grown to confluence and made quiescent for 12 h, and then the migration assay was initiated in the presence or absence of lysoPC (10 μM). The arrow indicates the starting line of migration. Original magnification, ×40. Bar, 100 μm. The bottom panel depicts migration results represented as mean ± SD (n = 3; * p < 0.001 compared with WT control and ** p < 0.001 compared with TRPC6−/− control). (B) MAECs were loaded with fura 2-AM. After adjusting the baseline, lysoPC (10 μM) was added to cells (arrow), and relative change of [Ca2+]i was monitored in WT (top panel) and TRPC6−/− MAECs (bottom panel). Each trace is representative of four separate experiments.

