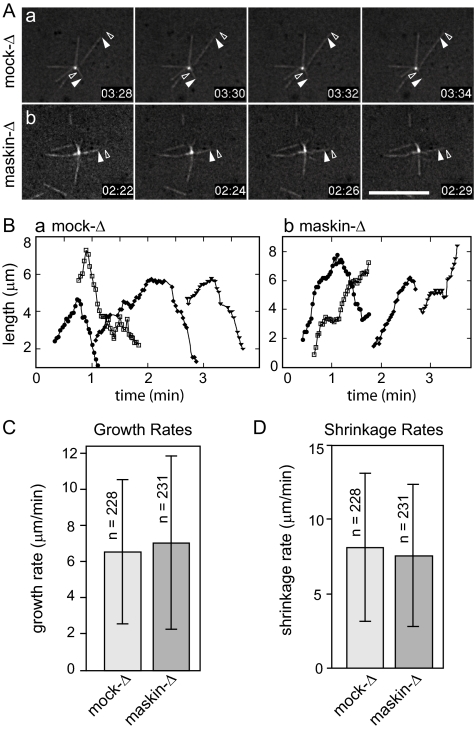
Figure 2.
Microtubule dynamics are not affected by maskin depletion. (A) Representative micrographs from time-lapse series showing microtubule dynamics in mock (a) or maskin-depleted (b) extracts supplemented with centrosomes. Closed arrowhead denotes the position of the microtubule end at the start; open arrowhead denotes the position of the microtubule end at the end of the time sequence. Elapsed time in minutes:seconds after the start of the recording is shown in the lower right of each panel. Corresponding videos are provided as Supplemental Videos 5 and 6. Bar, 10 μm. (B) Microtubule lifetime plots for four representative microtubules in mock-depleted (a) or maskin-depleted (b) egg extracts. (C and D) Quantification of microtubule growth (C) and shrinkage rates (D). Dynamics of 228 (mock-depleted) or 231 (maskin-depleted) microtubules in nine independent experiments were measured. These data are summarized in Table 1.

