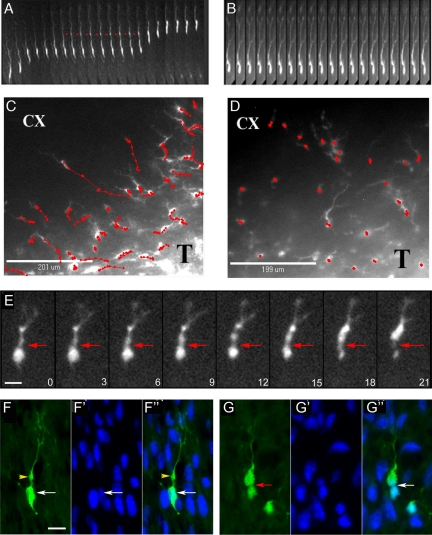
Figure 1.
Brain migration by PDGF-transformed, GFP-expressing rat glioma cells. Time-lapse microscopy was performed on 300-μm-thick slice cultures of PDGF-driven tumors at 10 d after injection. (A) Kymograph constructed from images taken every 15 min over the course of 5 h, illustrating the saltatory movement of a glioma cell as it infiltrates toward the cortex; the red arrow head points to the cytoplasmic swelling that forms in the leading process before nuclear translocation. (B) Kymograph (images taken every 15 min) of a cell in the cortex after the slice has been treated with 50 μM blebbistatin. Note that the cell body remains stationary, whereas the leading cytoplasmic process continues to extend forward. (C and D) Migratory paths of cells (red lines) without (C) and with (D) the addition of 50 μM blebbistatin. The migratory paths (red lines) of individual cells at the infiltrative edge of the tumor (T) and overlying cortex (CX) were tracked by marking the position of the cell body at consecutive time points (red dots correspond to position of cell body at 30-min intervals). (E) Time series (micrographs taken at 3-min intervals) showing the deformation of the cell body during a phase of cell body translocation. The red arrowhead points to a focal narrowing that occurs between the cell body and the swelling in the leading process through which the cell body constricts as it moves forward. (F and G) Micrographs of fixed sections stained for GFP (green) and DAPI (blue) showing GFP-expressing cells at different stages of the migratory sequence. F–F″ show a cell with the nucleus (white arrow) separated from a prominent dilatation in the leading process (yellow arrowhead). G–G″ show a cells with a focal deformation of the cell body and nucleus (red arrow). Bars, 10 μm.

