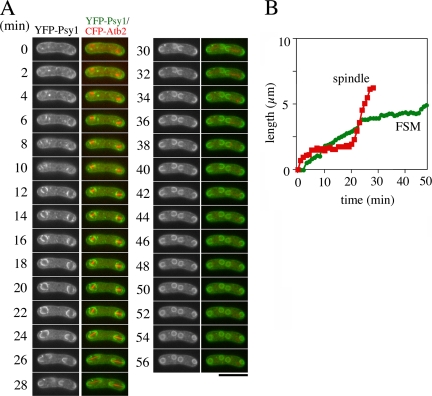
Figure 6.
Simultaneous observation of FSM and microtubules in the spo3 mutant. Two-color live imaging of YFP-Psy1 and CFP-Atb2 in spo3Δ mutant strain TN345. In merged images, YFP-Psy1 (green) and CFP-Atb2 (red) are shown. Frames were taken every 2 min. Bar, 10 μm. (B) Time course changes in the FSM and spindle microtubules during meiosis II. The contour lengths of FSMs (green line) and spindle microtubules (red line) are also shown.

