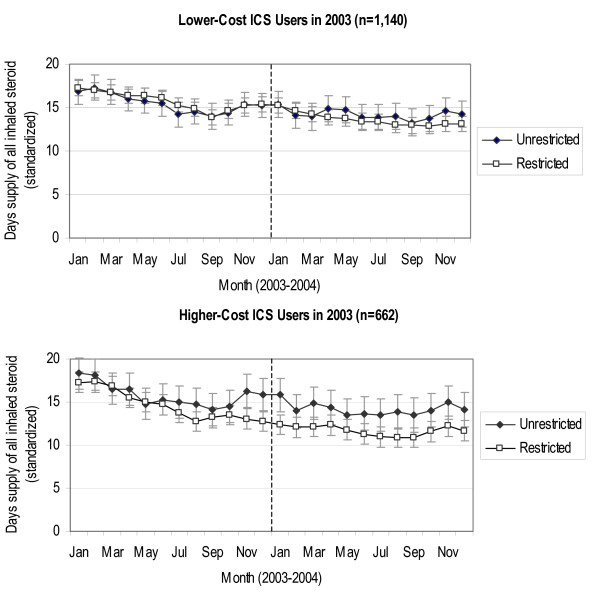
Figure 1.
Adjusted mean monthly ICS days-of-supply (2003–2004) for lower-cost and higher-cost ICS users in 2003 by coverage group. Note: The graph presents the adjusted mean monthly days-of-supply (standardized to a 30-day month) of all inhaled corticosteroids for the Unrestricted and Restricted Coverage groups. Bars represent 95% confidence intervals.

