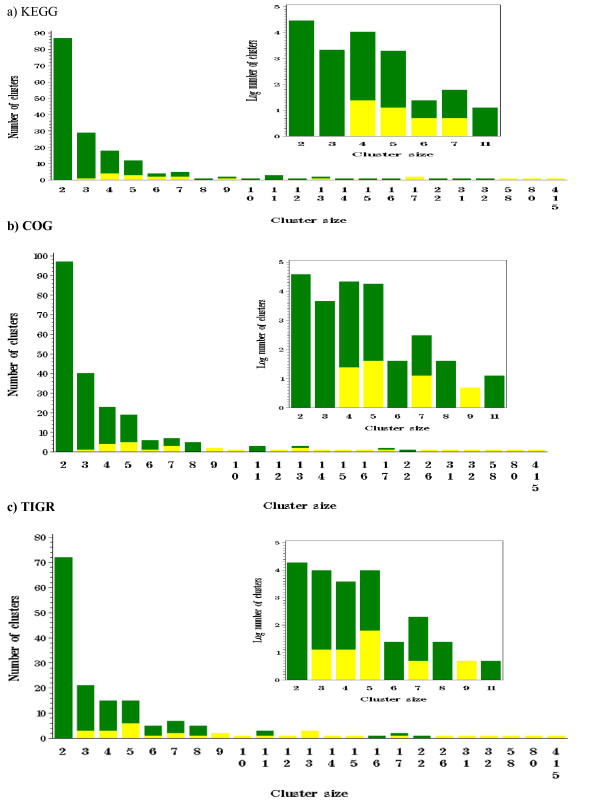
Figure 2.
The relationship between cluster size and function assignment. For clusters with at least two classified proteins, the number of clusters where all classified proteins in the cluster share the same functional category (green) or different categories (yellow). Unclassified proteins were not considered in the comparison. The x axis is the cluster size and the vertical bar shows the numbers of clusters. The insets show this information on the log scale for a cluster size <= 11. a) KEGG b) COG c) TIGR.

