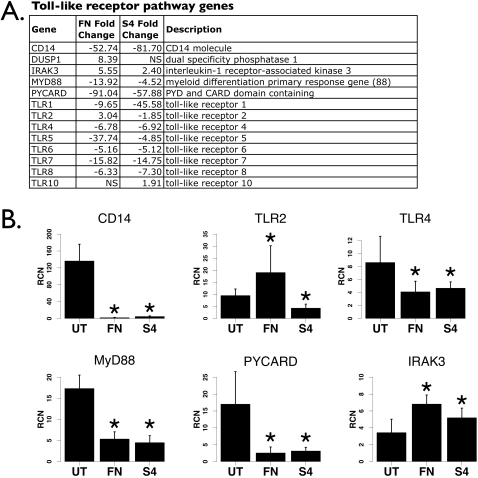
Figure 3. Toll-like receptor pathway genes affected by Francisella.
A. List of TLR pathway genes from the microarray analysis. Fold changes of genes not statistically different are denoted “NS”. B. Real-time PCR analyses of CD14, TLR2, TLR4, MyD88, PYCARD and IRAK-M from human PBM infected with either F. novicida (“FN”) or Schu S4 (“S4”) at an MOI of 100 for 24 hours (n = 8). “RCN” is Relative Copy Number for the Y axis. Asterisks denote statistical significance (p≤0.05) versus uninfected.

