
Figure 1.
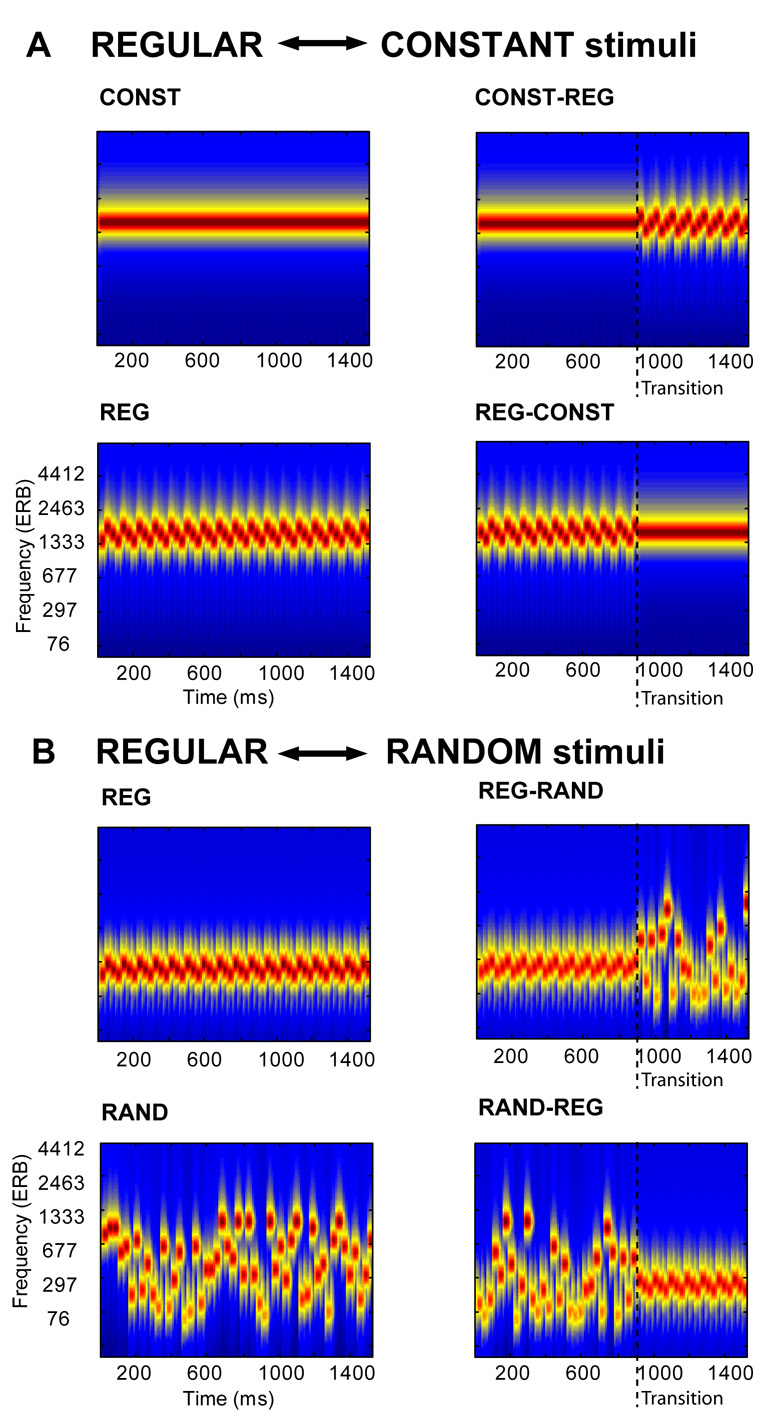
Examples of the stimulus configurations used in the experiment. The plots represent auditory spectrograms, generated with a filterbank of 1/ERB wide channels (Equivalent Rectangular Bandwidth; Moore & Glasberg, 1983) equally spaced on a scale of ERB-rate. Channels are smoothed to obtain a temporal resolution similar to the Equivalent Rectangular Duration (Plack & Moore, 1990). A: In one block, signals were either a constant tone (CONST), a regularly alternating sequence of three tone pips (REG) or contained a transition from constant to regular (CONST-REG) or vice versa (REG-CONST). The blue dashed line marks the transition. An ideal observer is able to detect the CONST-REG transition immediately; however the REG-CONST stimuli are only distinguishable from the REG (control) condition after one pip-duration has elapsed. B: In the other block, signals were either a regularly alternating sequence of three tone-pips (REG), a random sequence of tone-pips of different frequencies (RAND) or contained a transition from regular to random (REG-RAND) or vice versa (RAND-REG). The blue dashed line marks the transition. An ideal observer is able to detect the REG-RAND transition immediately, however the opposite transition (RAND-REG) necessarily takes longer to detect because a listener must wait long enough to distinguish the onset of regularity from an oscillation that might occur by chance.