
Figure 3.
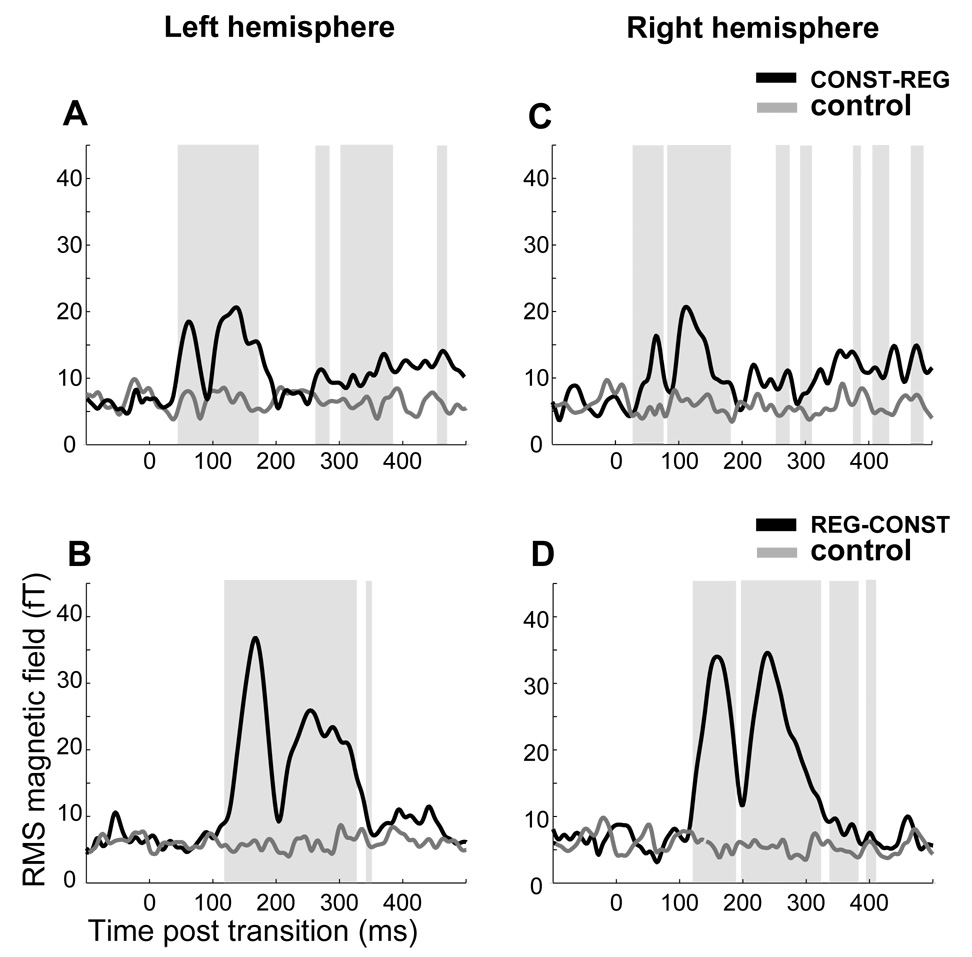
Transition responses in Constant↔Regular_stimuli. The plots illustrate the time points for which the ‘change’ conditions first diverge from their controls. A: grand-average RMS magnetic field of the CONST-REG transition (black) and its control (no change; CONST) in the left hemisphere. B: grand-average RMS magnetic field of the REG-CONST transition (black) and its control (no change; REG) in the left hemisphere. C: grand-average RMS magnetic field of the CONST-REG transition (black) and its control (no change; CONST) in the right hemisphere. D: grand-average RMS magnetic field of the REG-CONST transition (black) and its control (no change; REG) in the right hemisphere. Shaded areas mark time intervals where a significant difference is found between transition and control. Note that differences are computed in a repeated measures analysis and therefore may be marked as significant even when the grand-average RMS plot shows no difference between conditions.