
Figure 4.
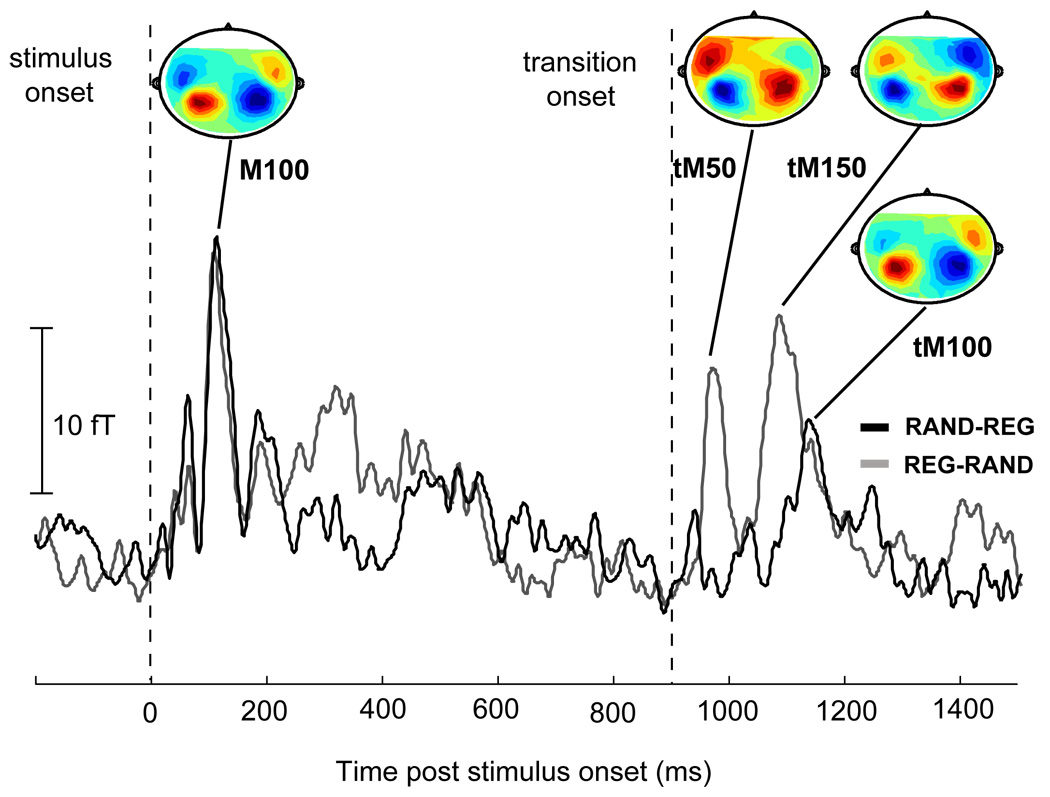
Measured data in the Random↔Regular block: Root mean square (RMS) of the grand-average (average over all subjects for each of the 156 channels) of the evoked auditory cortical responses to RAND-REG (in grey) and REG-RAND (in black) stimuli. Contour maps at the peaks are also provided; Source = red, Sink = blue. Onset response dynamics to CONST-REG and REG-CONST stimuli are identical. Both are characterized by a pronounced M100 onset response at approximately 110 ms post onset, with similar magnetic field distributions. Transition responses, however, differ greatly between REG-RAND and RAND-REG in both temporal dynamics and field distribution. The REG-RAND transition evokes a first deflection (tM50) peaking at about 70 ms post transition, with an M50-like magnetic field polarity, and another deflection (tM150) at about 180 ms post transition, also with an M50-like magnetic field pattern. The peak of the first response to the opposite (RAND-REG) transition (tM100) occurs at about 240 ms post transition, with an M100-like magnetic field polarity. All statistical analyses were performed on each-hemisphere, subject-by-subject (based on the 10 channels selected for each in each hemisphere). The grand-average plot is shown here for illustration purposes only.