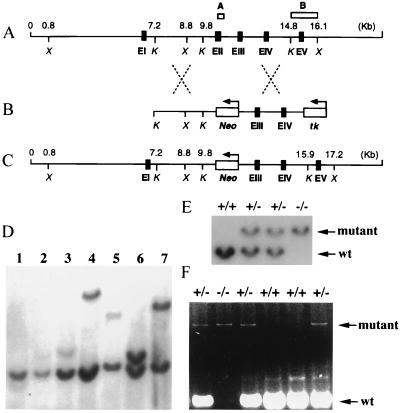
Figure 1.
Targeted disruption of the RHA gene. (A) Restriction map of the 16.1-kb 5′ genomic region of the RHA gene (6). (A and B) □ represent the genomic regions used for genotyping by PCR and Southern blot analyses, respectively. Exons (I to V) are indicated by ■. Italic letters X and K represent restriction enzymes XbaI and KpnI. (B) Replacement vector. The arrows above Neo and tk indicate the direction of transcription of each selection marker. (C) Structure of mutant RHA gene allele resulting from homologous recombination. (D) Southern blot analysis of targeted ES cell lines. Among 7 clones represented, only one ES clone (lane 6) exhibited an equal intensity of Southern signals between wild-type and mutant RHA alleles of the predicted sizes (see below). (E) Genotypes of E10.5 embryos. In D and E, probe B (see A) was used to detect restriction fragments indicative of the predicted gene replacement event at the RHA locus. XbaI digestion should produce 7.3-kb and 8.4-kb genomic fragments for wild-type (wt) and mutant RHA alleles, respectively. (F) Genotypes of E7.5 embryos obtained by PCR analysis. The insertion of the Neo gene in the mutant RHA allele leads to an increase of 1.1 kb in size of the PCR product compared with that of the wild-type allele (180 bp).

