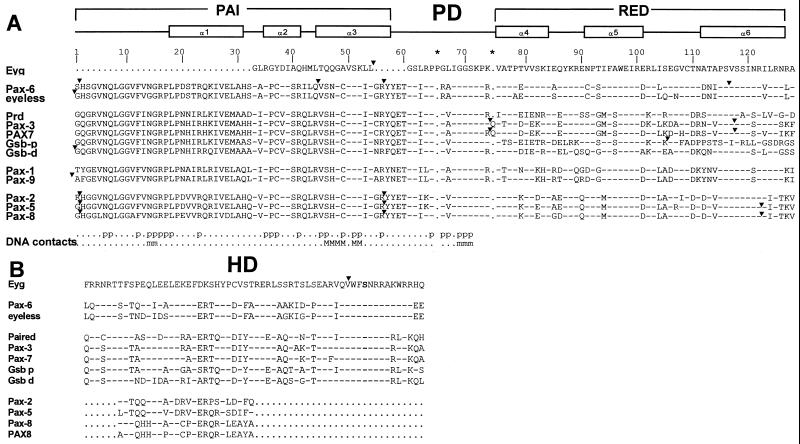
Figure 2.
Comparison of Eyg RED and HD sequences with other Pax proteins. Dashes indicate identity. (A) Comparison of Eyg RED domain with PD from each of the major subgroups. Above the comparison is a schematic that illustrates the position of the α-helices for the PAI and RED domains. Below the comparison, the residues that contact the DNA-binding site through phosphate (p), major groove (M) or minor groove (m) contacts have been indicated (5). The asterisks indicate additional residues within the PD that are found only in Eyg, Pax-3, or Pax-7. (B) Comparison of Eyg HD with that of other Pax genes. Arrowheads indicate the positions of introns.

