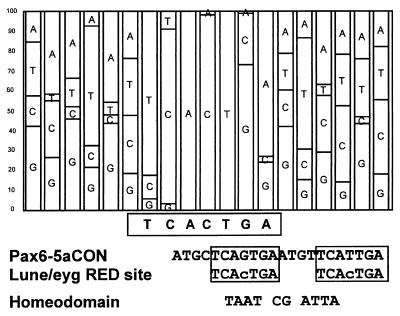
Figure 5.
(Upper) In vitro binding-site assays. SELEX-derived sequences for the RED domain of Eyg. The panels display base preferences in the form of a consensogram. The height of each bar represents the total percentage of instances that a given base occurs at a position. To construct the consensogram, 40 sequences were assessed and aligned. (Lower) Comparison of the Pax-6 5a binding site (5aCON) with the Eyg RED-domain binding site. Boxed regions emphasize regions of similarity.

