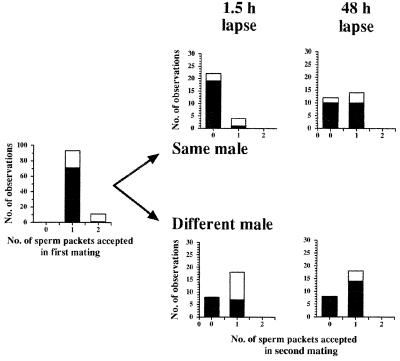
Figure 2.
Frequency distribution of the number of spermatophores accepted by females in their first mating (Left) and second mating (Right). For the females’ first mating, data from both experiments (1.5-hr and 48-hr intermating interval) and mating treatments (SM and DM) were pooled. For the females’ second mating, results were partitioned by intermating interval and mating treatment. Filled areas in the bars indicate the number of matings in which the male deposited an additional spermatophore that was rejected by the female.

