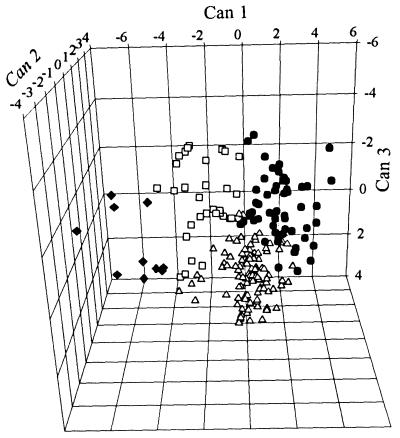
Figure 3.
Three-dimensional representation of the four clusters including both plant and insect phenotypes (each point represents a single plant or insect). Cluster analysis was performed to identify groups of chemically similar phenotypes in webworm detoxification and plant furanocoumarin production. Before cluster analysis, insect metabolism rates and plant furanocoumarin contents were standardized to a mean of one by dividing each individual value by the raw mean value across all populations. Clusters were produced by Proc fasclus Version 6.12 (SAS Institutes, Cary, NC). Proc candisc was used to generate three canonical variables (CAN1, CAN2, and CAN3) from the cluster analysis output for use in plotting the four clusters in three-dimensional space.

