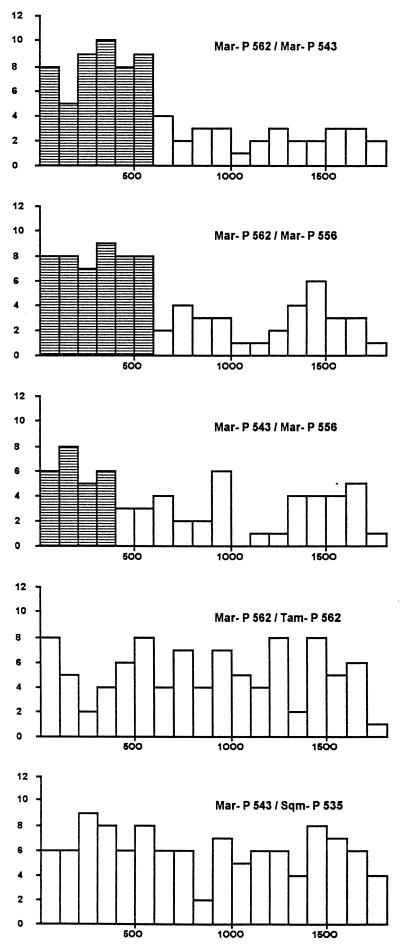
Figure 3.
Histograms showing pairwise variation in divergence as a function of position in intron 4. Horizontally, each bar represents a 100-bp segment. Vertically, each bar shows the number of nucleotide differences per segment. Three within-species and two between-species comparisons are shown (Mar, marmoset; Tam, tamarin; Sqm, squirrel monkey).

