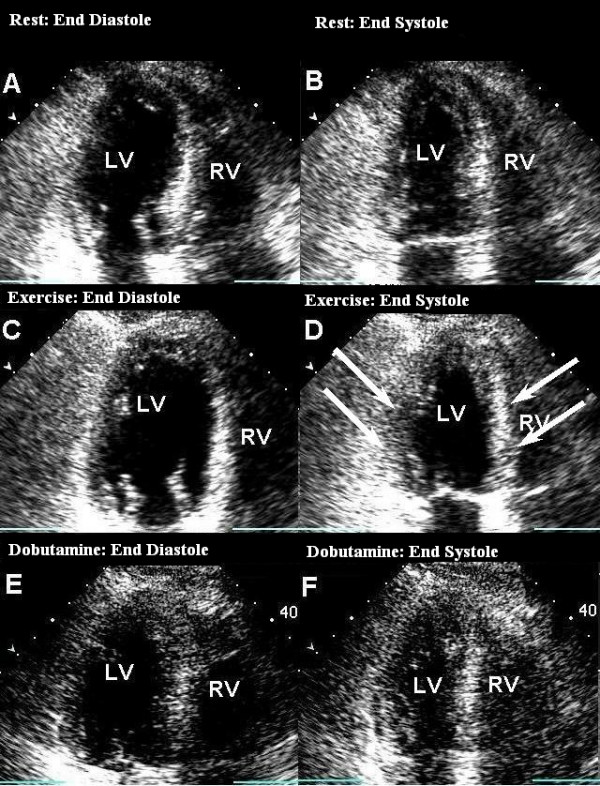
Figure 2.

Treadmill Exercise test showing basal akinesis, and mid-LV hypokinesis, with normal apical contractility during peak stress. Images A and B were taken during rest, and C and D are at peak stress, A and C represent diastolic frames, B and D represent systolic frames. Image D shows basal and mid-LV wall motion abnormality. Images E (end-diastole) and F(end-systole) are from Dobutamine stress test at peak stress. Image F is an end systolic frame showing good contraction of all the segments as compared to D. (LV: Left Ventricle, RV: Right ventricle).
