
Figure 1.
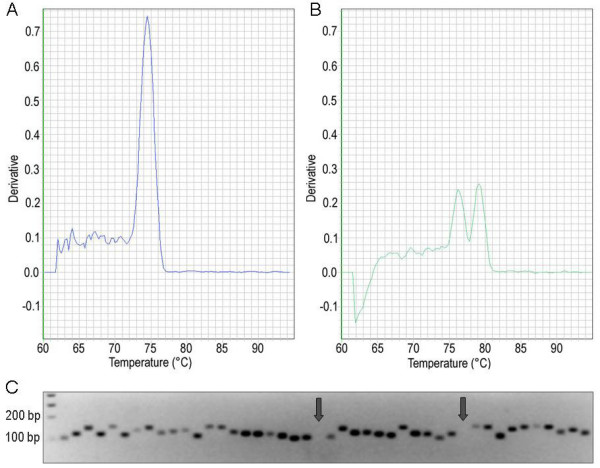
Specificity of transcription factor PCR primers. Specificity was confirmed by dissociation curves with a single peak (A) while double peaks (B) indicated off-target ampification. The derivative of fluorescence intensity is shown on the y-axis. Separation of PCR products on 3% (v/w) agarose gels following electrophoresis (C) confirmed the presence of unique amplicons of the expected size for most reactions. Few reactions yielded no products (indicated by arrow).